AWA: Academic Writing at Auckland
Title: Build-A-Bow Design Tool
|
Copyright: Jonathan Kah
|
Description: Implement a design tool for your chosen mechanical product in Microsoft Excel using VBA. Describe the task undertaken, the methods used in implementing a spreadsheet solution, printed copies of relevant portions of the spreadsheet and macros, and examples of the analyses (eg charts or tables). Include instructions on how to run the spreadsheet. Describe your own contribution to the group project and discuss aspects of the group process which you appreciated, or which you might do differently next time.
Warning: This paper cannot be copied and used in your own assignment; this is plagiarism. Copied sections will be identified by Turnitin and penalties will apply. Please refer to the University's Academic Integrity resource and policies on Academic Integrity and Copyright.
Build-A-Bow Design Tool
|
Build-A-Bow Design ToolGroup 6
Jonathan KahTable of Contents
Introduction:
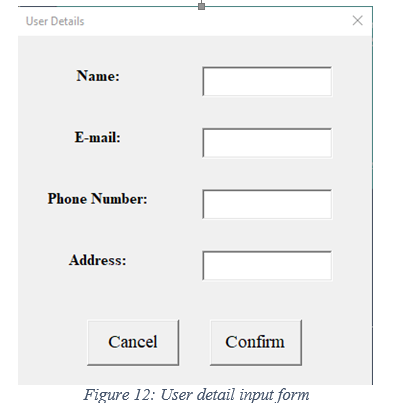
The bow market is very small and diminishing as the sport dies – Build-A-Bow is here to turn that around and revive the art of archery. In order to aid the popularization of this sport, we have developed a design tool in Microsoft Excel that allows users to explore the design space of a recurve bow and arrow. This tool is aimed at archers of all levels, from complete beginners to professional competition- grade consumers, to be as intuitive and simple to navigate as possible. Designing a bow and arrow for use is a complex procedure, with components depending on user details (armspan, strength) and its intended purpose (hunting, competition, general practice). Once the user enters these details into the order form, a recurve bow that suits them will automatically be generated and they will be taken to a simulation of the arrow being shot. Their design is then rated in three areas: cost, range and maximum height. They are then offered the choice to continue modifying their product, or proceed to the invoice. The following report will detail the development and implementation of this design tool in Microsoft Excel, utilising VB code and macros in accordance with the project specification. It will cover how spreadsheets were used to implement the design of the user interface, as well as instructions on how to use it. Next, my main contributions towards the project, with the most significant being the calculations, will be covered. Finally, the detailing of the group dynamics.
User Interface:
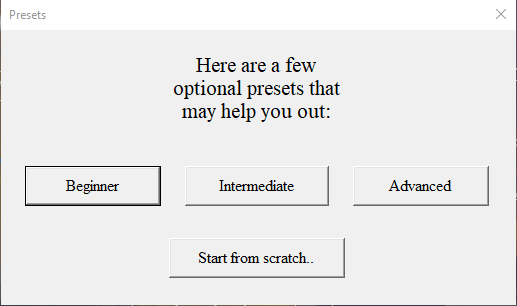
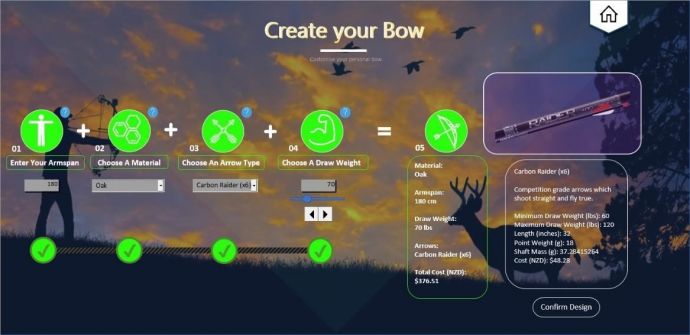
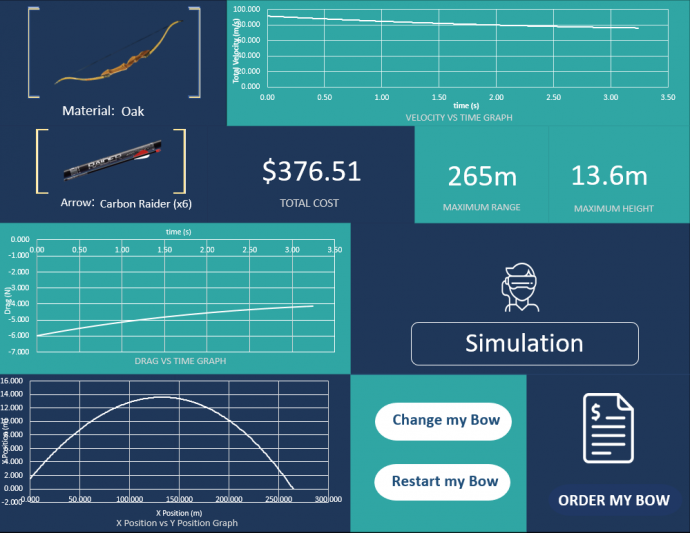
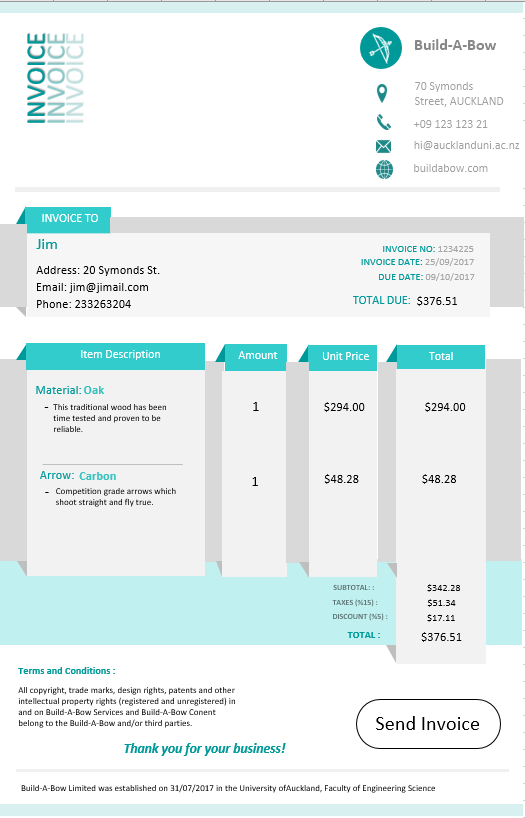
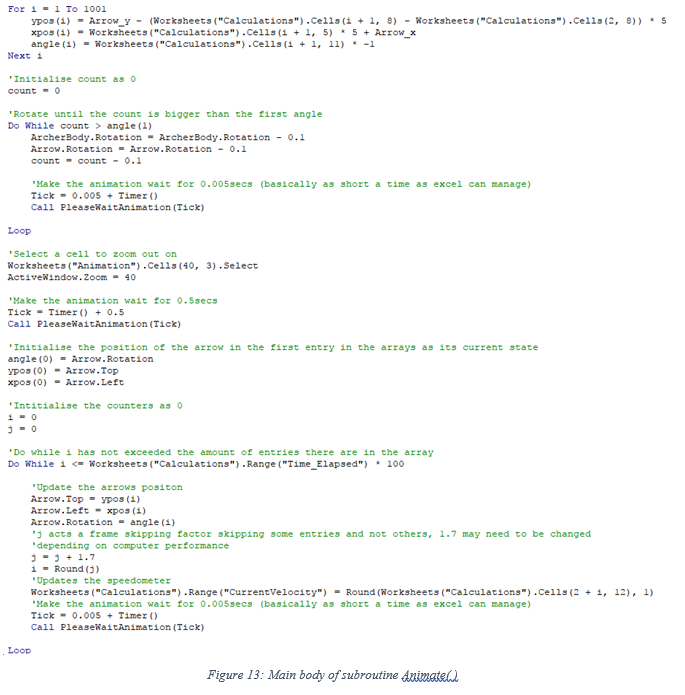
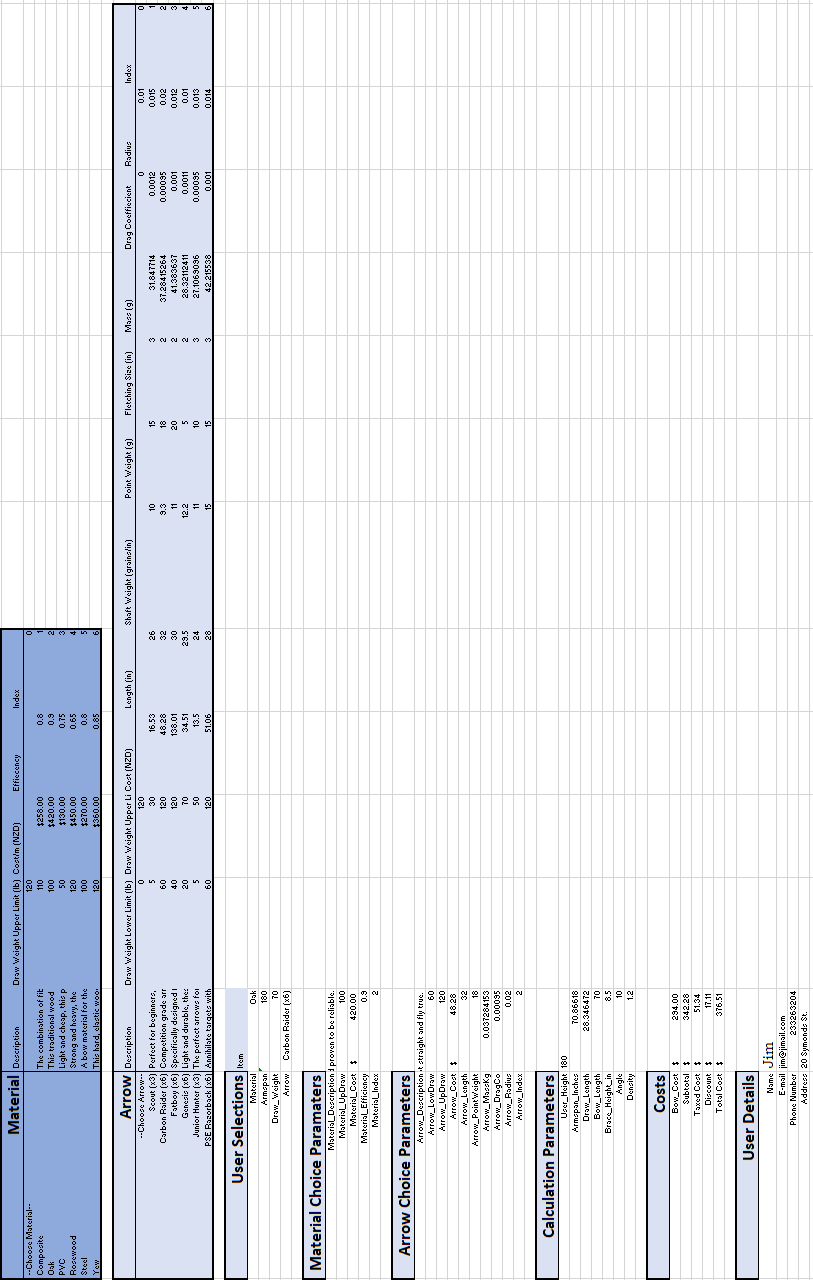
The development tool we used to create Build-A-Bow was Microsoft Excel, including coding in VBA, and manipulating userforms. Upon start-up, the user is presented with a home screen (Figure 1). Once the “Get Started” button is pressed, a transition to the order form is played. The user is then asked to select from a range of preset bows, or to start from scratch (Figure 2). This allows for ease of ordering for complete beginners, or professionals who just want the best of the best. At any time, the user is able to click the home button to return to the home page. The order form is the most complex sheet in the workbook. It implements a progress bar coded in VBA that updates based on the user input. If all inputs are valid (Figure 3), the order form is complete and the user can progress by using the “Confirm” button. A combination of text entry, combo boxes, and spin buttons were used to select/input the data. When the user selects a material/arrow, an image and its description appear in the information box on the right (See Figure 3). The draw weight entry is scaled, such that the slider bar’s limits match the draw weight limits of both the material and arrow, drawn from the Data sheet (Figure 14). ActiveX controls, also coded in VBA were used to implement the mouseover help events. All user entries were checked by the progress bar subs to be valid before allowing the user to advance to the results page. Once the user decides to submit their bow and arrow, they are then taken to the results page, where key calculations, height and cost are displayed. Graphs that dynamically update show how the magnitude of velocity, magnitude of drag force, and the position changes with time (Figure 4). They are then given the option to simulate the arrow being fired using our animation, or to progress to the invoice. The animation (Figure 11. Note that due to the zoom the input “Input Angle”, and outputs “Max Range” and “Max Velocity” are too small to read) has options to change the angle that the arrow is fired at (0 °-10°), and the medium shot through (air, vacuum or water). It works by calling a subroutine Animate( ) that reads the data output by the calculations (Figure 9), stores a scaled output to x position, y position, and theta arrays, and moves the archer and arrow shapes through the specified position and angle (Figure 13). The size of these shapes was slightly exaggerated so that the user is able to see the arrow being fired. As a result, the arrow appears to stop before hitting the ground, which is an improvement that we could make if we were to undertake this project again. There is also a speedometer which shows how the arrow travels, in terms of magnitude of velocity. It is scaled from the minimum to maximum of any designable bow, so different designs are able to be gauged against each other. When the user progresses to the invoice, they are prompted to enter their details into the box (Figure 12). Error handling was implemented to ensure valid inputs to these. The completed invoice will be displayed (Figure 10). To finish off, the “Send Invoice” button will reset the entire project. All transitions between sheets were activated by macros linked to VB subs.
Using the spreadsheet:
Personal contribution:
Team Coordinator One of my main contributions to this project was as my role as group coordinator. This involved arranging weekly meetings with an agenda. Furthermore, I had to change from an individual viewpoint to a systems perspective, having to understand how different parts of the tool worked together and interacted. This allowed me to split the workload into manageable chunks, and to delegate these to group members. I supervised their work and ensured it was done to a satisfactory standard. Lastly, I was responsible for setting the goals of where we wanted to be at any given time, and having to visualise the end product and aiming towards that. Researcher – Concept and calculations: Another role I had within this project was as a researcher. I populated the data tables, using data obtained from an online archery catalogue. For the drag coefficient parameter, I found typical values and ranges, and made an educated guess about what it was going to be. I researched the main parameters affecting a bow purchase, and how these interact with each other to give tangible, numerical results. This led me to speak to an amateur archer with ten years’ experience, and from that conversation the concept was born.
Calculations The most significant role I had in this project was to cover the calculations. This involved four iterations of derivations: the velocity decay rate; a projectile motion model that neglected drag in the y-direction, drag in x-direction proportional to v2; a projectile motion model with drag in both x- and y-directions proportional to v; and a projectile motion model with drag in both x- and y- directions proportional to v2. The full derivations can be found in Appendix B. These were then considered and implemented into VB code if feasible. Firstly, the derivation of the velocity decay rate. This was done using a force balance on the arrow as it is in flight. I assumed that the drag force would be proportional to ðœ‹ð‘Ÿ2, the cross-sectional area of the arrow shaft; ðœŒ, the density of the medium that the arrow would be flying through; and ð¶ð·, the drag coefficient of each arrow. This gives an expression for the velocity decay rate used in force balance equations such as
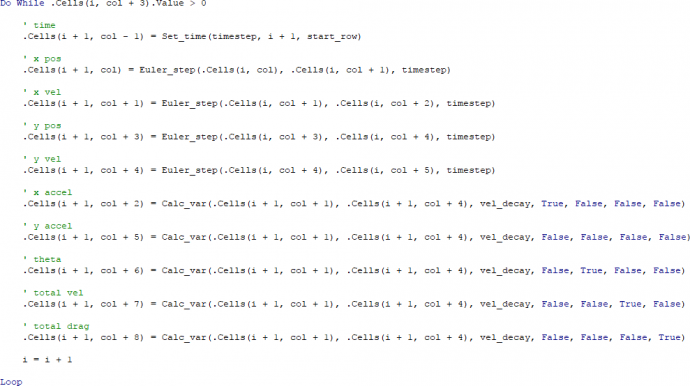
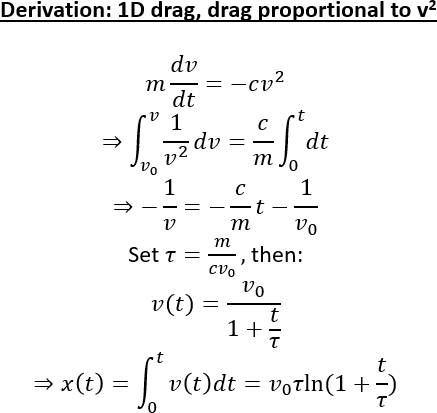
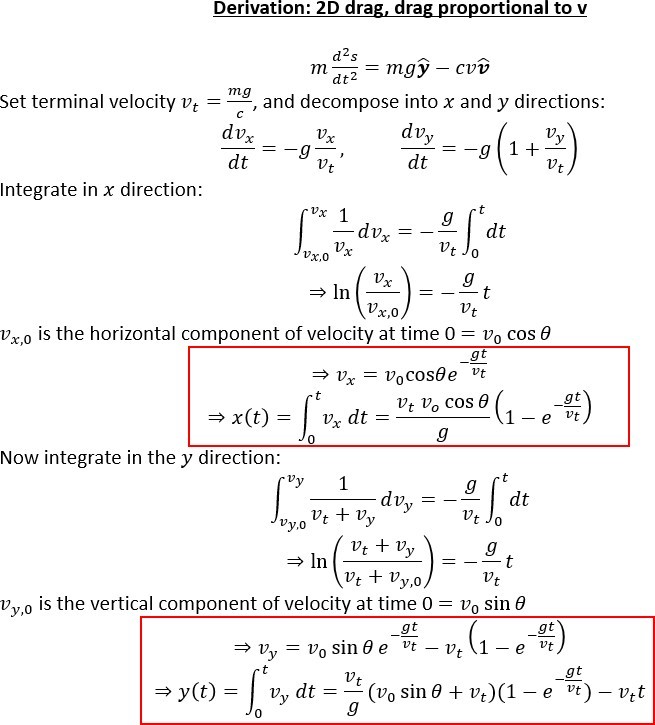
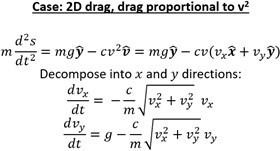
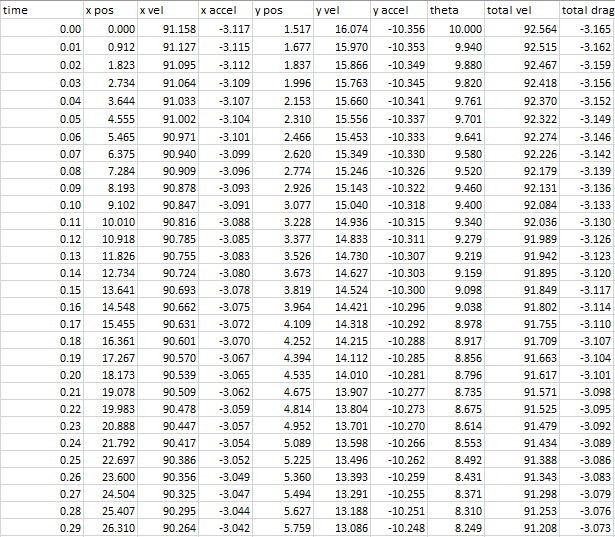
Secondly, the derivation that neglects of drag in the y-direction (Figure 6). I did this first as I thought that since the x velocity is much greater than the y velocity, the effects of drag in the vertical direction could be ignored. As shown in Appendix B, analytic solutions are obtained for both ð‘£(ð‘¡) and ð‘¥(ð‘¡). However, on upon implementation into VBA, the output results were inaccurate when the angle of fire 𜃠was greater than 0. It is obvious that the drag in the y-direction can not be neglected, as when firing an arrow upwards, it is clearly going to experience drag force in the y-direction. Thirdly, the derivation using the assumption that drag was proportional to v (Figure 7). This assumption was made in order to obtain an analytic solution. However, due to the nasty exponential and trigonometric terms, the implementation into VBA was very slow (15 seconds to call calculation table). Furthermore, this was inaccurate when 𜌠was small, proving that my initial assumption that drag was proportional to v was unfounded and completely incorrect (when firing through fluids such as air). This led to the fourth implementation of calculations. Upon decomposing the force balance expression into x and y directions, I found that ð‘£ð‘¥ and ð‘£ð‘¦ were coupled ODEs (Figure 8). This means that there are no analytic solutions, and to find either ð‘£ð‘¥ or ð‘£ð‘¦, iterative methods would have to be used. Since this is computationally expensive (we are calculating at 0.01s timesteps so there were between 100-1000 computations needed for each velocity), I decided to resort to using Euler’s method to estimate the flight path, flight angle, velocity, acceleration, and drag upon the arrow. The VB implementation of this can be found in Appendix B. The call to the Calculate_main( ) sub produces an output table as shown in Appendix B, showing at each timestep: x and y positions, velocities, accelerations; the angle of flight theta; and the magnitude of the total velocity and drag vectors acting upon the arrow. Each row of the table is populated in a loop. Each of the variables were calculated by calling functions such as Euler_step and Calc_var, using the input data from the row i, and written into row i+1 (Figure 5). The loop then increments i and continues to populate the table until the y position is less than 0 (i.e. the arrow hits the ground). From these calculations, the graphs on the Results page are formed. Each time the Calculate_main( ) sub is called, these graphs dynamically update so as to display the output of the most recent parameters. Also on the Results page, are the outputs of maximum range and height at the input angle on the Animations page.
Group dynamics:I believe the strengths of our group was the communications system we implemented. From the beginning, a Slack group was set up so that communications could be had without distractions, unlike Facebook messaging. This, compounded with the weekly progress meetings, ensured every team member was clear on their current objective, with no ambiguity surrounding what was required of them. This allowed the group to keep each other accountable to make progress each week. However, there were times where people did not check Slack, due to forgetfulness or negligence. Josh also only attended two of the weekly check-ins. This is obviously not ideal, so we had to deal with this problem by finding him outside of the designated meeting time. A Google Drive was set up to host all the files for the project. This allowed for efficient file sharing and the most updated version would always be in the cloud, ready to be accessed anywhere. While this worked well, at the beginning of the project, people consistently uploaded books with terrible names e.g. Book3, Book4, Book5, etc. Once that was rectified, the file sharing system was much improved as there was no confusion about which was the most updated book. However, there were issues regarding the most updated version, when more than one person was doing work on the sheet simultaneously. This resulted in team members having to merge sheets together into a single version again. Keeping track of all the changes one does and merging the sheets is impractical, and forced us to let only one person work on the book at a time. Delegation of tasks within the group was a mixed success. We decided to divide the main sections of the project in such a way that each member played to their strengths. The decision was to set [team member name] on the aesthetic design and visual theme of the workbook; [team member name] to calculations; [team member name] to the animation; [team member name] as the main VB coder; and myself as coordinator and support coder. However, things quickly went downhill after the first week of implementing the visualised tool. It was a mistake to have each person responsible of such a large section of the project – for example [team member name] could only work on the visuals of each sheet after we had finished implementing the code behind it. Also of concern was when group members were not doing tasks assigned to them – I had to take over the calculations for [team member name] when we decided to implement drag into our projectile motion model. I then put him in charge of the User Forms and error handling within the book. Naming and shaming worked to some degree here, and the project was directed back on track. Because certain tasks could not be started until others had finished, the project management and delegation of tasks could definitely have been handled better by me. The coding practices within our group were appalling. Subroutines were written to sheets instead of to modules and then called; virtually no commenting in entire subroutines of code; and terribly chosen variable names (such as “Oval 24”, “Flowchart Terminator 127”). This added a lot of stress when we were trying to debug each other’s code when we implemented a new feature. The attitude of the other group members towards this is still one of indifference – I had to make them go through and comment their code. If this project were to be repeated, I would definitely stress at the beginning how important it is to comment code you write and to implement good coding practices. Overall, the experience in this group was positive as members responded to feedback given to them by other group members. Although there are multiple aspects we could have improved on, we were able to learn from these weaknesses to be more effective team members in future projects.
Conclusion:We have created a design tool which allows an archer to customise a bow and arrow to fit their needs. The tool allows the user to simulate the shot of an arrow. Through the technical information output, user-friendliness, ease of use and aesthetic appeal of the user interface, we believe we have met the user requirements outlined in the introduction.
Appendix – Figures:
Figure 1: Home screen
Figure 2: Preset options
Figure 3: Order Form, completed Figure 4: Sample output, Results page
Figure 5: Loop to populate of one row of calculation table Figure 6: Derivation, neglecting y-direction drag
Figure 7: Derivation, assuming drag is proportional to v
Figure 8: Derivation, assuming drag is proportional to v2
Figure 9: Sample of output calculation table
Figure 10: Invoice
Figure 11: Animation page
Figure 14: Data sheet |